Early assessment of product market fit can save months of wasted work. This guide covers practical signals you can track before you scale. It uses simple metrics, cheap experiments, and direct customer feedback. Many founders treat fit as a binary milestone. That is a mistake. Fit is a set of measurable indicators that change over time. I will show ways to avoid vanity metrics and focus on leading signals that matter. You will learn how to set quick hypotheses, pick a small set of metrics, and run fast validation loops. The aim is to make product decisions with evidence, not hope. Practical warnings appear along the way. Many startups miss churn trends and confuse early enthusiasm with durable demand. Read on if you want a clear framework to test demand, retention, and monetization without blowing your runway. If you want a related deep dive, read How To Set Product Metrics And KPIs For Startups That Scale.
Start With A Clear Hypothesis And Signals
Begin with a crisp hypothesis about who needs your product and what problem it solves. Write down the expected user action that proves value. Then list two to four leading indicators you can measure fast. For example expect a certain percent of trial users to complete an activation task or expect repeat visits within a week. Keep the signals small and observable. Use short feedback loops. Run one experiment at a time and collect both usage data and direct feedback. Practical warning, do not stack many assumptions into one hypothesis. That makes results ambiguous. A focused hypothesis helps you learn quickly and avoid sunk cost bias. Over time update your signals based on new learning and move to stronger tests when early results look promising. For a practical follow-up, see A Practical Process for Iterating Product Features Based on Feedback.
- Define the target user and core value action
- Pick two to four leading indicators
- Run one experiment at a time
- Collect both data and qualitative feedback
Quantitative Metrics That Matter Early
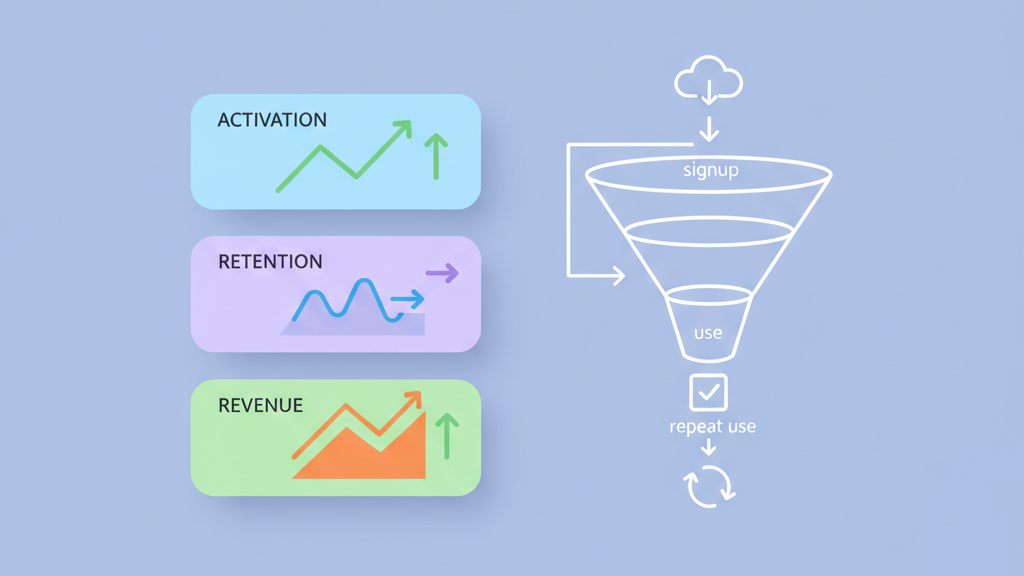
Track metrics that show adoption and continued use without waiting for revenue. Activation rate is the percent of new users who complete a key setup task. Early retention measures return visits or actions within seven to fourteen days. Engagement depth tracks how many core actions a user performs in a session. Referral rate is a cheap signal of enthusiasm. Revenue per engaged user can be a proxy even if you do not charge yet. Avoid vanity metrics that look good but do not link to value. Focus on cohort level trends, not raw totals. Use small cohorts to run rapid A B tests. Practical warning, spikes from marketing can mask poor retention. Always compare cohorts over the same time window so you see true behavioral changes. A related guide worth reviewing is Uncovering the Key Metrics for Monitoring MVP Effectiveness in Startup Growth.
- Measure activation for core tasks
- Track short term retention cohorts
- Monitor engagement depth
- Watch referral and organic growth signals
Use Qualitative Signals To Explain Numbers
Numbers tell you what happened, interviews tell you why. Schedule five to ten interviews each week with recent users. Ask about the last time they used the product and what they achieved. Observe users completing tasks if possible. Support tickets and session replays are a gold mine of real issues and surprises. Use open ended questions and avoid leading prompts. Look for language that shows users view your offering as indispensable or as a nice to have. Note repeated pain points and feature requests. These qualitative signals help you interpret metric shifts and design better experiments. Mild opinion, founders often undervalue quick user calls. Those calls reveal truth faster than long internal debates. If you need implementation support, explore Mobile app development.
- Run regular user interviews
- Review support tickets and session replays
- Look for language that indicates value
- Use findings to shape next experiments
Design Cheap Experiments And Cohort Tests
Experiment design should be cheap and fast. Use fake doors, landing pages, and concierge tests to validate demand before building full features. Split small cohorts to test variations in onboarding, messaging, or pricing. Keep sample sizes manageable so you can finish tests in one to three weeks. Track the same indicators across cohorts to spot real differences. Use qualitative follow ups to understand surprising outcomes. If an experiment fails, record the lesson and iterate. Many teams stop testing too soon or run experiments that do not measure the core value action. That wastes time. A good experiment is focused, measurable, and tied to a clear hypothesis about user behavior.
- Use fake doors and landing pages
- Split cohorts for onboarding tests
- Keep tests to one to three weeks
- Follow up with qualitative checks
Set Stop Criteria And Success Thresholds
Define clear thresholds that tell you when to double down and when to pivot. For each indicator set what success looks like and what failure looks like. For example decide the minimum activation rate you need to justify more investment in onboarding. Create stop rules for projects that drain resources. These rules keep teams honest and reduce emotional attachment to ideas. Review results at regular intervals and be willing to prune experiments that underperform. Keep a short list of critical metrics and do not let noise distract you. Warning, optimistic founders often move thresholds after seeing poor results. Fix thresholds before running tests to avoid bias and improve learning quality. Teams moving from strategy to execution can review MVP development for startups.
- Define success and failure thresholds
- Create stop rules for low impact work
- Keep a short list of critical metrics
- Review and prune regularly
Communicate Findings And Plan Next Moves
Share concise updates with the team and stakeholders. Use simple dashboards that highlight the leading indicators and recent experiments. Tell a short story with data and what you will do next. Prioritize one or two changes based on the strongest signals. If early indicators are weak, plan a focused pivot or a set of higher quality tests. If indicators are strong, invest in scaling the validated flows. Use the same language in meetings and documentation so everyone aligns. Mild opinion, vague reporting breeds confusion and slow decisions. Clear communication speeds up good choices and reduces wasted effort.
- Show key indicators on a simple dashboard
- Report experiments and decisions
- Prioritize one or two next moves
- Align language across the team