Building a simple analytics dashboard requires thoughtful data choices. This guide walks founders and product managers through analytics dashboard application MVP data model best practices and pragmatic tradeoffs for the first release. We focus on clarity over cleverness and on things you can test quickly. Many startups miss essentials and then pay for fixes later. If you want a related deep dive, read Building an Analytics Dashboard Software MVP for Product Managers: A Practical Guide.
Start With Data Ownership And Goals
Begin data design by naming who owns each source and what decisions the dashboard must support. Many teams skip this and build metrics that no one trusts. Define primary stakeholder jobs and the key questions they will ask during meetings. Map each dashboard card to a decision and to the source of truth for the data. Keep the initial schema minimal so the MVP is easy to explain and validate with users. Plan for change by adding clear ownership and a lightweight change log. This reduces debates later and speeds up onboarding for new team members. In my experience founders benefit from pacing the scope to what they can instrument and verify in the first three months. That pragmatic focus lowers risk and keeps the team aligned. For a practical follow-up, see Uncovering the Key Metrics for Monitoring MVP Effectiveness in Startup Growth.
- Assign ownership for each data source
- Map cards to specific business decisions
- Keep the initial schema minimal
- Add a lightweight change log
- Validate definitions with stakeholders
Model For Speed And Scale
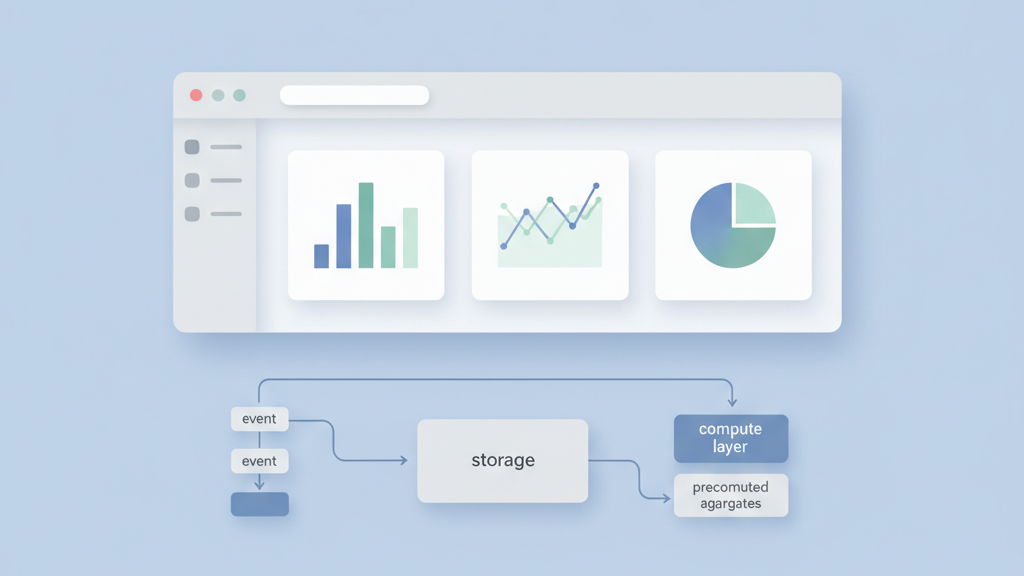
Choose data primitives that match query patterns, not just raw business objects. I prefer a simple event table for writes and a set of precomputed aggregates for reads. This hybrid model helps the MVP stay fast without premature optimization. Keep column types explicit to avoid subtle bugs in joins and filters. Use surrogate keys sparingly and prefer natural keys when they make joins simpler and safer. Plan for partitioning by time or tenant early so scaling is easier later. Many startups miss this and then face a painful migration. Document the expected query templates and put limits on ad hoc queries in the early phase. That keeps costs predictable and makes your product easier to demo to investors. Add monitoring early. A related guide worth reviewing is How To Set Product Metrics And KPIs For Startups That Scale.
- Use event table for writes
- Precompute common aggregates for reads
- Choose explicit column types
- Plan partitioning early
- Limit ad hoc queries
Event And Metric Design
When defining events and metrics, be ruthless about naming. Use a consistent verb noun pattern and keep definitions in one shared doc. Decide on metric windows and default aggregations up front to avoid surprises when the product grows. Track raw events alongside derived metrics so you can rebuild numbers if definitions change. Many teams forget to record the raw event payload so historical audits become impossible. Add version fields for metric definitions and store the compute logic in code or notebooks that are version controlled. That makes it easier to explain differences when stakeholders question numbers. Practical testing of metric calculations must be part of your release checklist even during the MVP phase. Test edge cases for missing and duplicated events before launch. If you need implementation support, explore MVP development for startups.
- Use consistent event naming
- Record raw payloads for audits
- Version metric definitions
- Store compute logic in code
- Test metric edge cases
Storage And Access Patterns
Choose storage with the access pattern in mind. Use columnar stores for analytics queries that scan large ranges. Use a transactional store for user level lookups and joins. Keep a small materialized layer for common dashboard views to reduce latency. Use a cache for high frequency reads and set clear eviction rules. Separate compute from storage so you can scale each independently and control costs. Many founders underestimate the tradeoffs between latency and cost. Track query performance and cost per query from day one. Prune rarely used partitions and archive cold data into cheaper storage. Define clear SLAs for dashboard refresh times and think about graceful degradation when full data is not yet available. Teams moving from strategy to execution can review Mobile app development.
- Match storage to query patterns
- Use materialized views for hot queries
- Cache frequent reads
- Separate compute from storage
- Archive cold data
Testing And Iteration Strategy
Build testing into the data pipeline and into the dashboard UI. Compare metrics against a trusted baseline and automate smoke checks after each deploy. Include end to end tests that run on a small dataset against production like data. Have a rollback plan for schema changes and a staging pipeline that mirrors production. Use feature flags to gate new metrics so you can validate without affecting users. Solicit feedback from the first 10 power users and bake that into a rapid iteration loop. Many teams skip rigorous testing because they want to move fast. That is a false economy. A few simple guards prevent embarrassing mistakes in investor demos and prevent product decisions based on bad data. Track test coverage for critical metrics continuously.
- Automate smoke checks on deploy
- Run end to end tests on sample data
- Use feature flags for new metrics
- Have schema rollback plans
- Collect early user feedback